GaugeFlood
Flood risk scoring and mapping for insurance underwriters
GaugeFlood helps insurers visualize flood risk and claims potential at the property-level with nationwide flood scores and risk data.
Keep your book above water.
GaugeFlood is the premier web-based flood risk scoring and mapping solution covering the continental U.S. — including its coastlines and all 4.6 million miles of river and stream networks — with individual-address granularity. P&C insurance underwriters can assess flood risks by region or individual address to write better policies. GaugeFlood risk models offer sophisticated assessments for river flooding, flash flooding and coastal storm surge to create the most complete insurance flood maps on the market today.
U.S. flood losses average almost $8B annually. After a severe rain event, how many of your P&C policies could be underwater?

Visualize flood risks
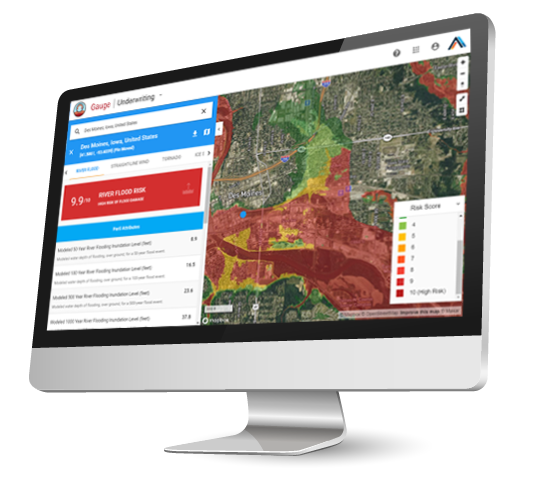
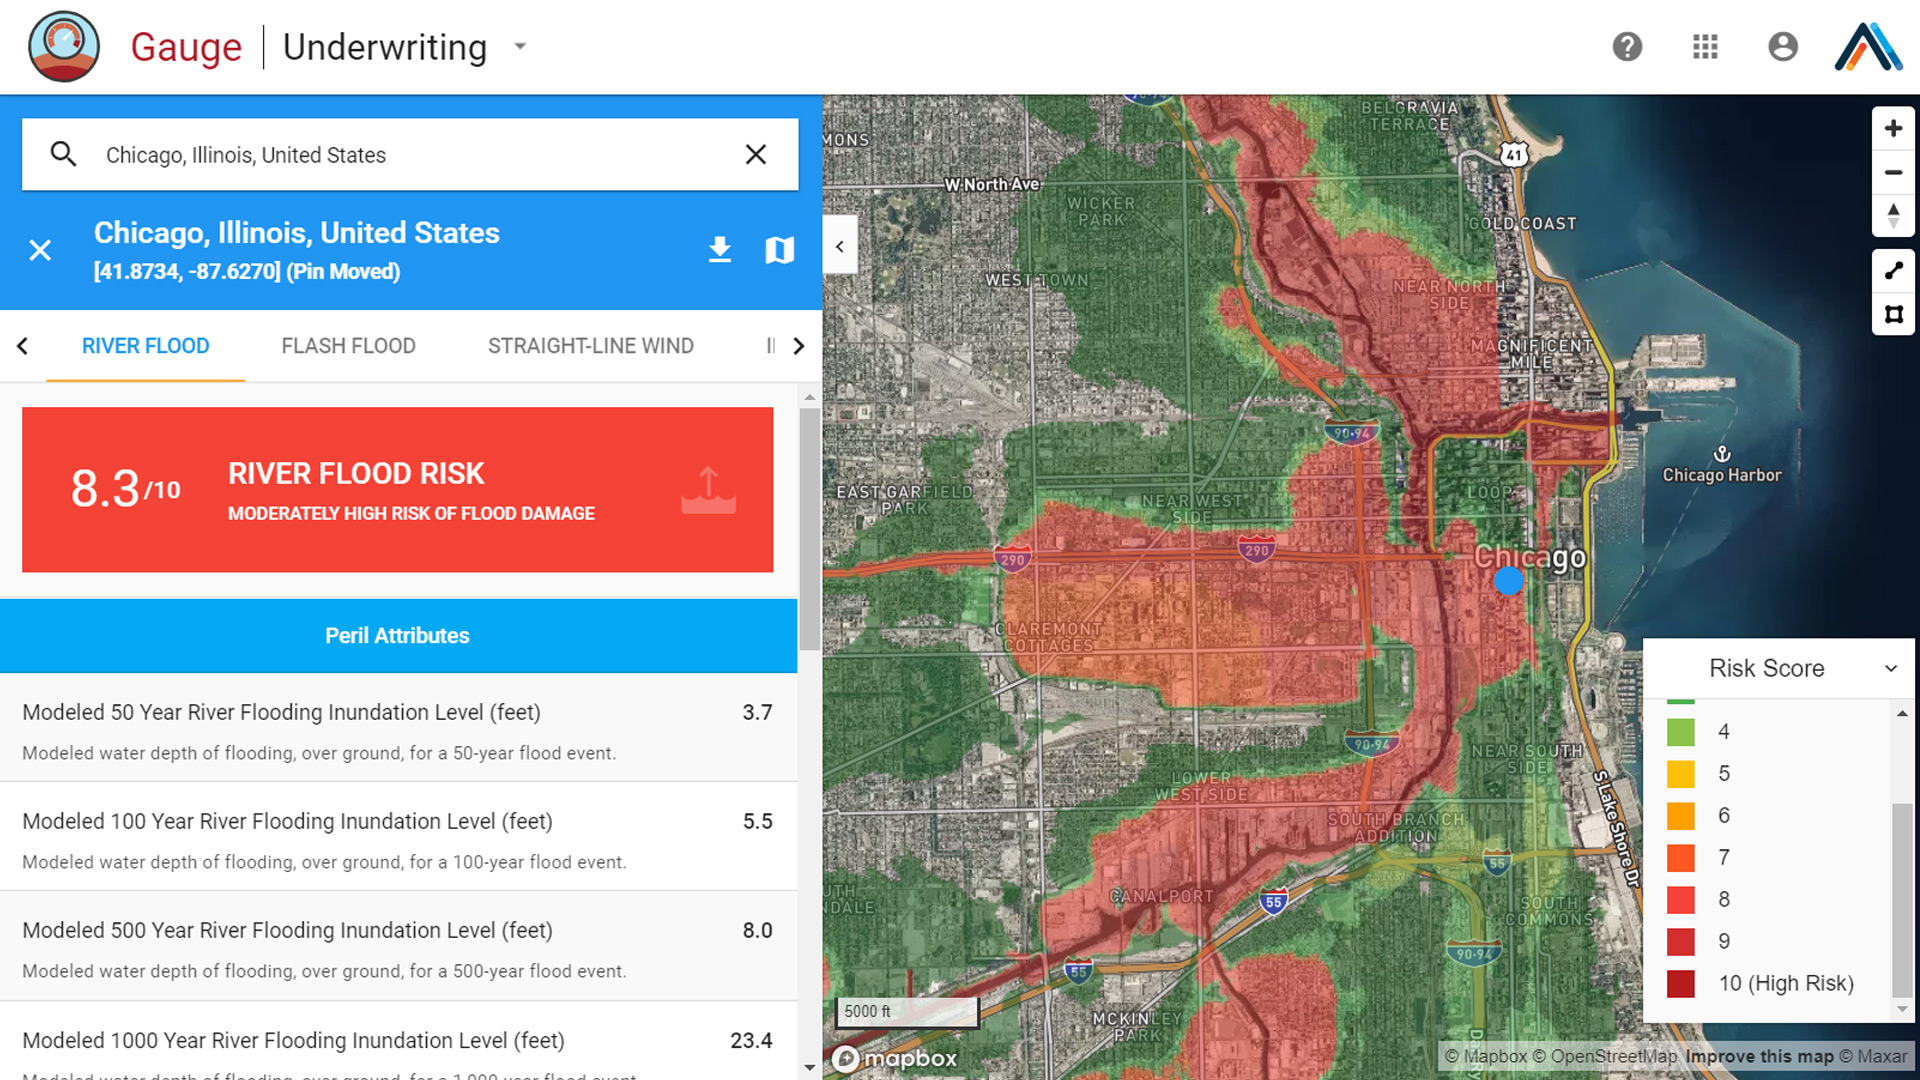
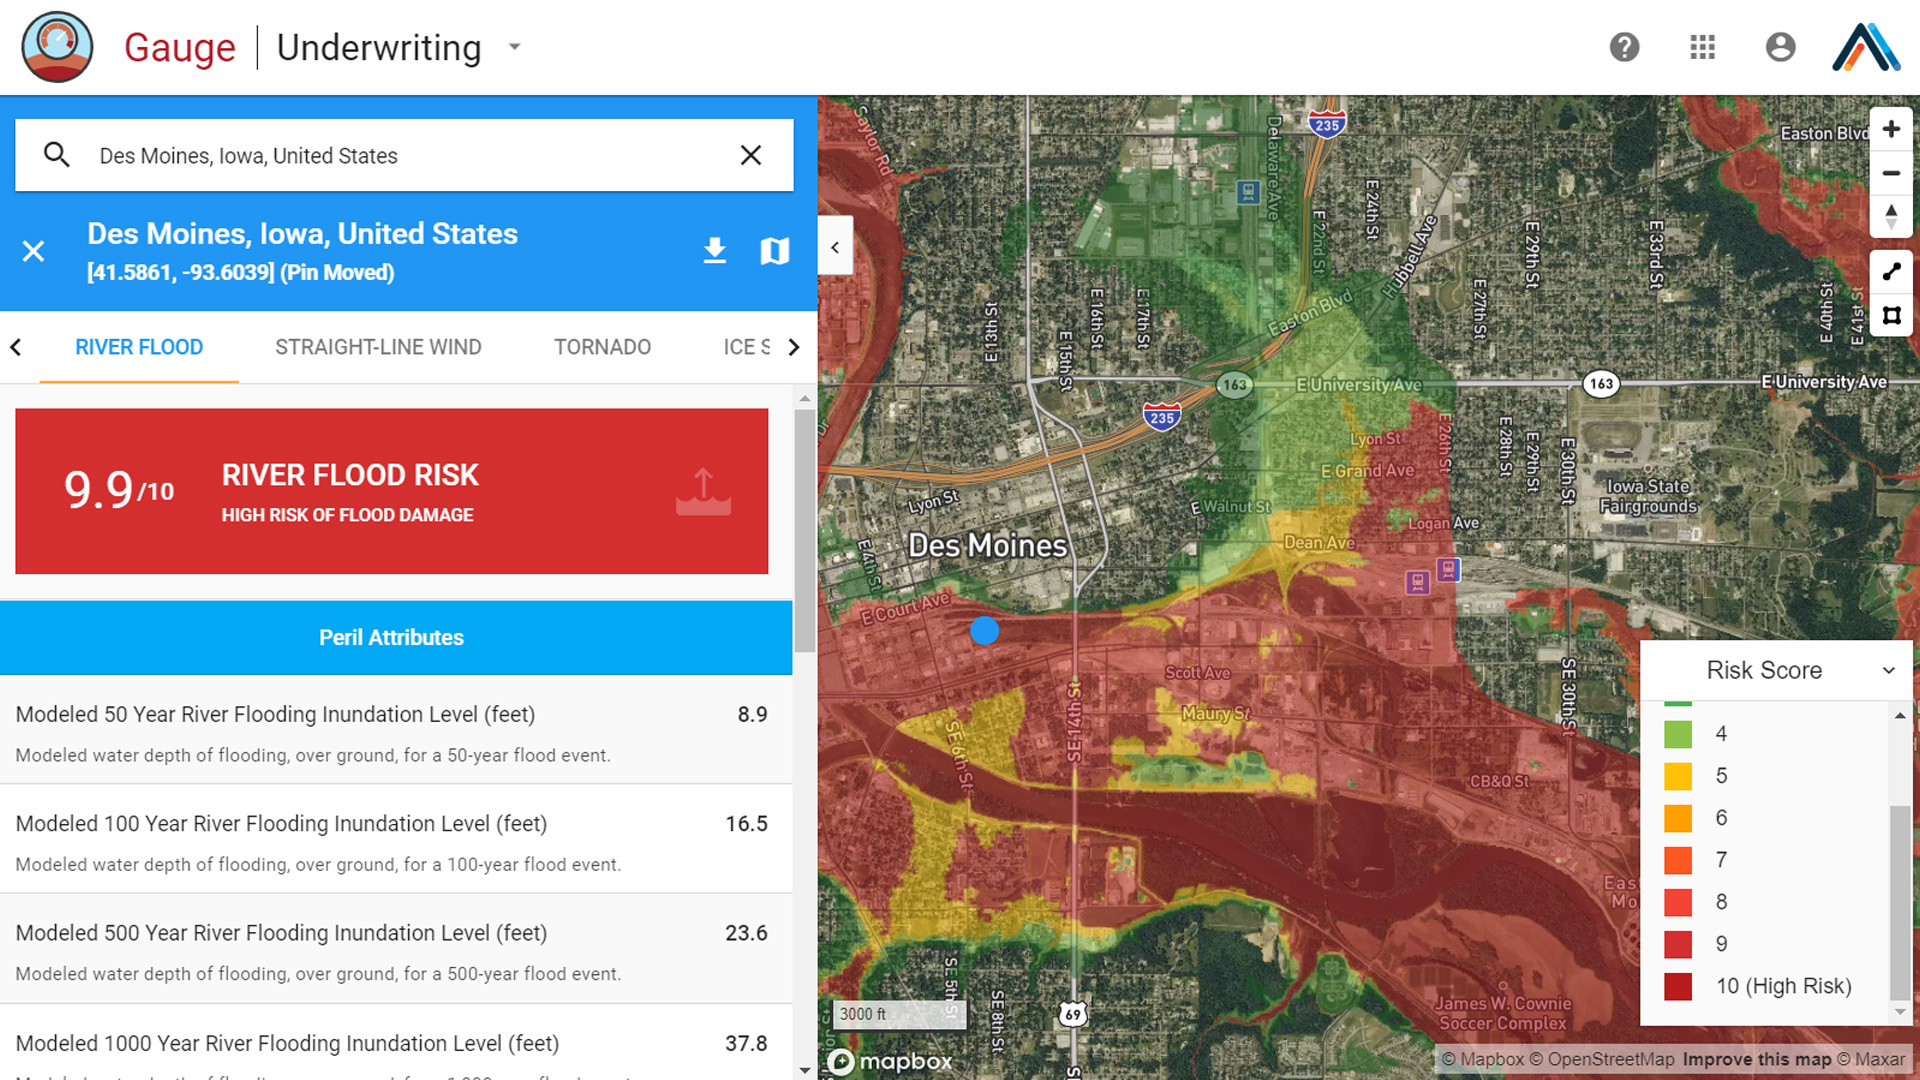
GaugeFlood offers all the flood risk data underwriters need to write smart business. Search properties, overlay maps and view proprietary risk attributes with 10-meter accuracy. How do elevation and distance to water affect your flood risks?
We have scores for that.

Assess your exposures
Visualize inland and coastal flood risks and view valuable data on elevation, distance to water, inundation levels and hurricane frequency scores to understand the true risk of flooding at any property in your portfolio. Need to know how risky a policy could be?
We have scores for that.

Write nationwide business
We combine risk maps, scores and data into a single dashboard to help you understand how properties will be affected by flood events based on geospatial risk factors. How will the next 50-, 100- or 500-year storm affect your book?
We have scores for that.

Visualize flood risks
GaugeFlood offers all the flood risk data underwriters need to write smart business. Search properties, overlay maps and view proprietary risk attributes with 10-meter accuracy. How do elevation and distance to water affect your flood risks?
We have scores for that.
Assess your exposures
Visualize inland and coastal flood risks and view valuable data on elevation, distance to water, inundation levels and hurricane frequency scores to understand the true risk of flooding at any property in your portfolio. Need to know how risky a policy could be?
We have scores for that.
Write nationwide business
We combine risk maps, scores and data into a single dashboard to help you understand how properties will be affected by flood events based on geospatial risk factors. How will the next 50-, 100- or 500-year storm affect your book?
We have scores for that.
GaugeFlood offers the most complete flood risk scoring available.
Don’t rely on fragmented, outdated FEMA flood coverage maps anymore. GaugeFlood offers the most complete flood risk scoring available. Search any property to instantly view FEMA-designated flood zones overlaid with our sophisticated, proprietary geospatial risk data based on elevation, distance to water and severe weather frequency.


Write smarter business and improve reinsurance using hyperlocal flood risk scores

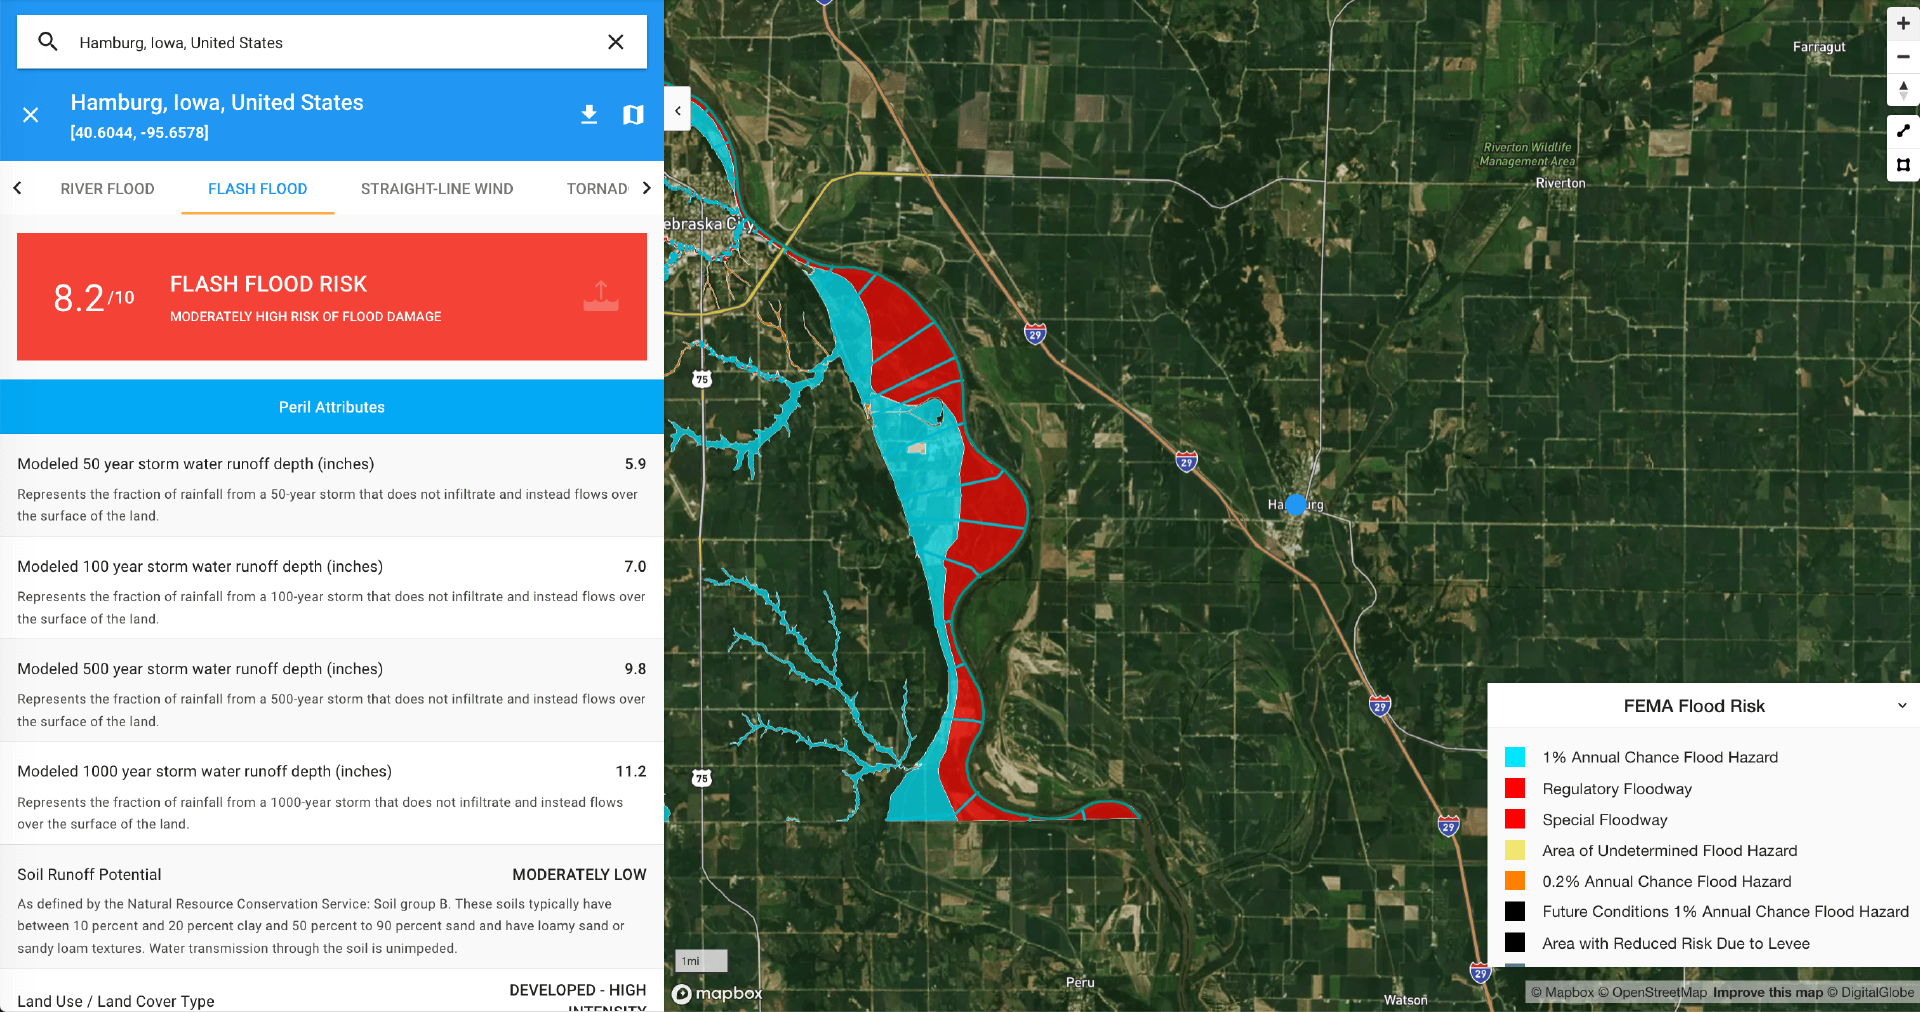
Flash flood
Our flood risk maps scores locations based on soil hydrologic attributes, land use and land cover types, rainfall intensity and topography to help you determine which areas are prone to flash floods.

River flood
Studies show inland flood plains could expand by 45% by 2100. We score the risk factors including elevation and distance to water to model runoff depth for 50-, 100-, 500- and 1000-year storm events.

Storm surge
Our storm surge module offers risk scores and proprietary inundation levels for tropical storm and hurricane storm surge heights. Factors include elevation, distance to the coast and hurricane frequency/intensity.
Inspect the regional risks of insured locations.
Our flood zone overlays allow underwriters to understand general risk areas for flood and government requirements for insurance.
Gauge river flood score
The risk associated with a flood when a river or stream overflows its banks. The score is representative of frequency (the likelihood of a flood occurring at any point in time) and severity (the expected depth of flood water) at the searched location. The scoring is accurate to a horizontal resolution of 33 feet (10 m).
1% annual chance flood hazard
A 100-year flood.
0.2% annual chance flood hazard
A 500-year flood.
Regulatory floodway
The channel of a river or other watercourse and the adjacent land areas that must be reserved to discharge the base flood without cumulatively increasing the water surface elevation more than a designated height.
Special floodway
The land covered by the floodwaters of the base flood is the Special Flood Hazard Area (SFHA)
Area of undetermined flood hazard
Areas with possible but undetermined flood hazards or where no flood hazard analysis has been conducted.
Gauge storm surge risk score
The risk of any surge water height from a hurricane. The score is representative of frequency (how often each category of storm has occurred) and severity (the “worst case” surge water height for each category of storm) at the searched location. The scoring is accurate to a horizontal resolution of 33 feet (10 m) used in Gauge Hurricane Surge analysis
Future conditions 1% annual chance
A 1% annual chance of a flood hazard.
Area with reduced risk due to levee
Flood hazard zone on the landward side of the levee
Coastal barrier resources system
A system of protected coastal areas that includes ocean-front land and the Great Lakes. The coastal barriers serve as buffers between coastal storms and inland areas, often protecting properties from serious flood damage
Base flood elevation
The computed elevation to which floodwater is anticipated to rise during the base flood.
FEMA-demarcated regulatory floodways
Line file for regulatory floodway.
Inspect the regional risks of insured locations.
Our flood zone overlays allow underwriters to understand general risk areas for flood and government requirements for insurance.
Gauge river flood score
The risk associated with a flood when a river or stream overflows its banks. The score is representative of frequency (the likelihood of a flood occurring at any point in time) and severity (the expected depth of flood water) at the searched location. The scoring is accurate to a horizontal resolution of 33 feet (10 m).
1% annual chance flood hazard
A 100-year flood.
2% annual chance flood hazard
A 500-year flood.
Regulatory floodway
The channel of a river or other watercourse and the adjacent land areas that must be reserved to discharge the base flood without cumulatively increasing the water surface elevation more than a designated height.
Special floodway
The land covered by the floodwaters of the base flood is the Special Flood Hazard Area (SFHA)
Area of undetermined flood hazard
Areas with possible but undetermined flood hazards or where no flood hazard analysis has been conducted.
Gauge storm surge risk score
The risk of any surge water height from a hurricane. The score is representative of frequency (how often each category of storm has occurred) and severity (the “worst case” surge water height for each category of storm) at the searched location. The scoring is accurate to a horizontal resolution of 33 feet (10 m) used in Gauge Hurricane Surge analysis
Future conditions 1% annual chance
A 1% annual chance of a flood hazard.
Area with reduced risk due to levee
Flood hazard zone on the landward side of the levee
Coastal barrier resources system
A system of protected coastal areas that includes ocean-front land and the Great Lakes. The coastal barriers serve as buffers between coastal storms and inland areas, often protecting properties from serious flood damage
Base flood elevation
The computed elevation to which floodwater is anticipated to rise during the base flood.
FEMA-demarcated regulatory floodways
Line file for regulatory floodway.
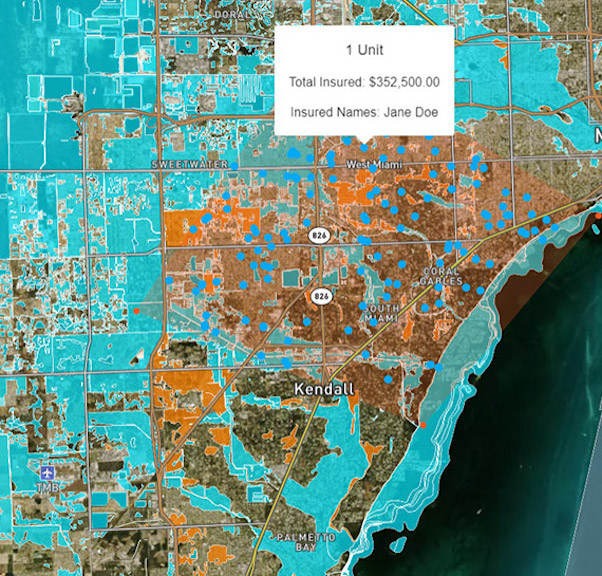
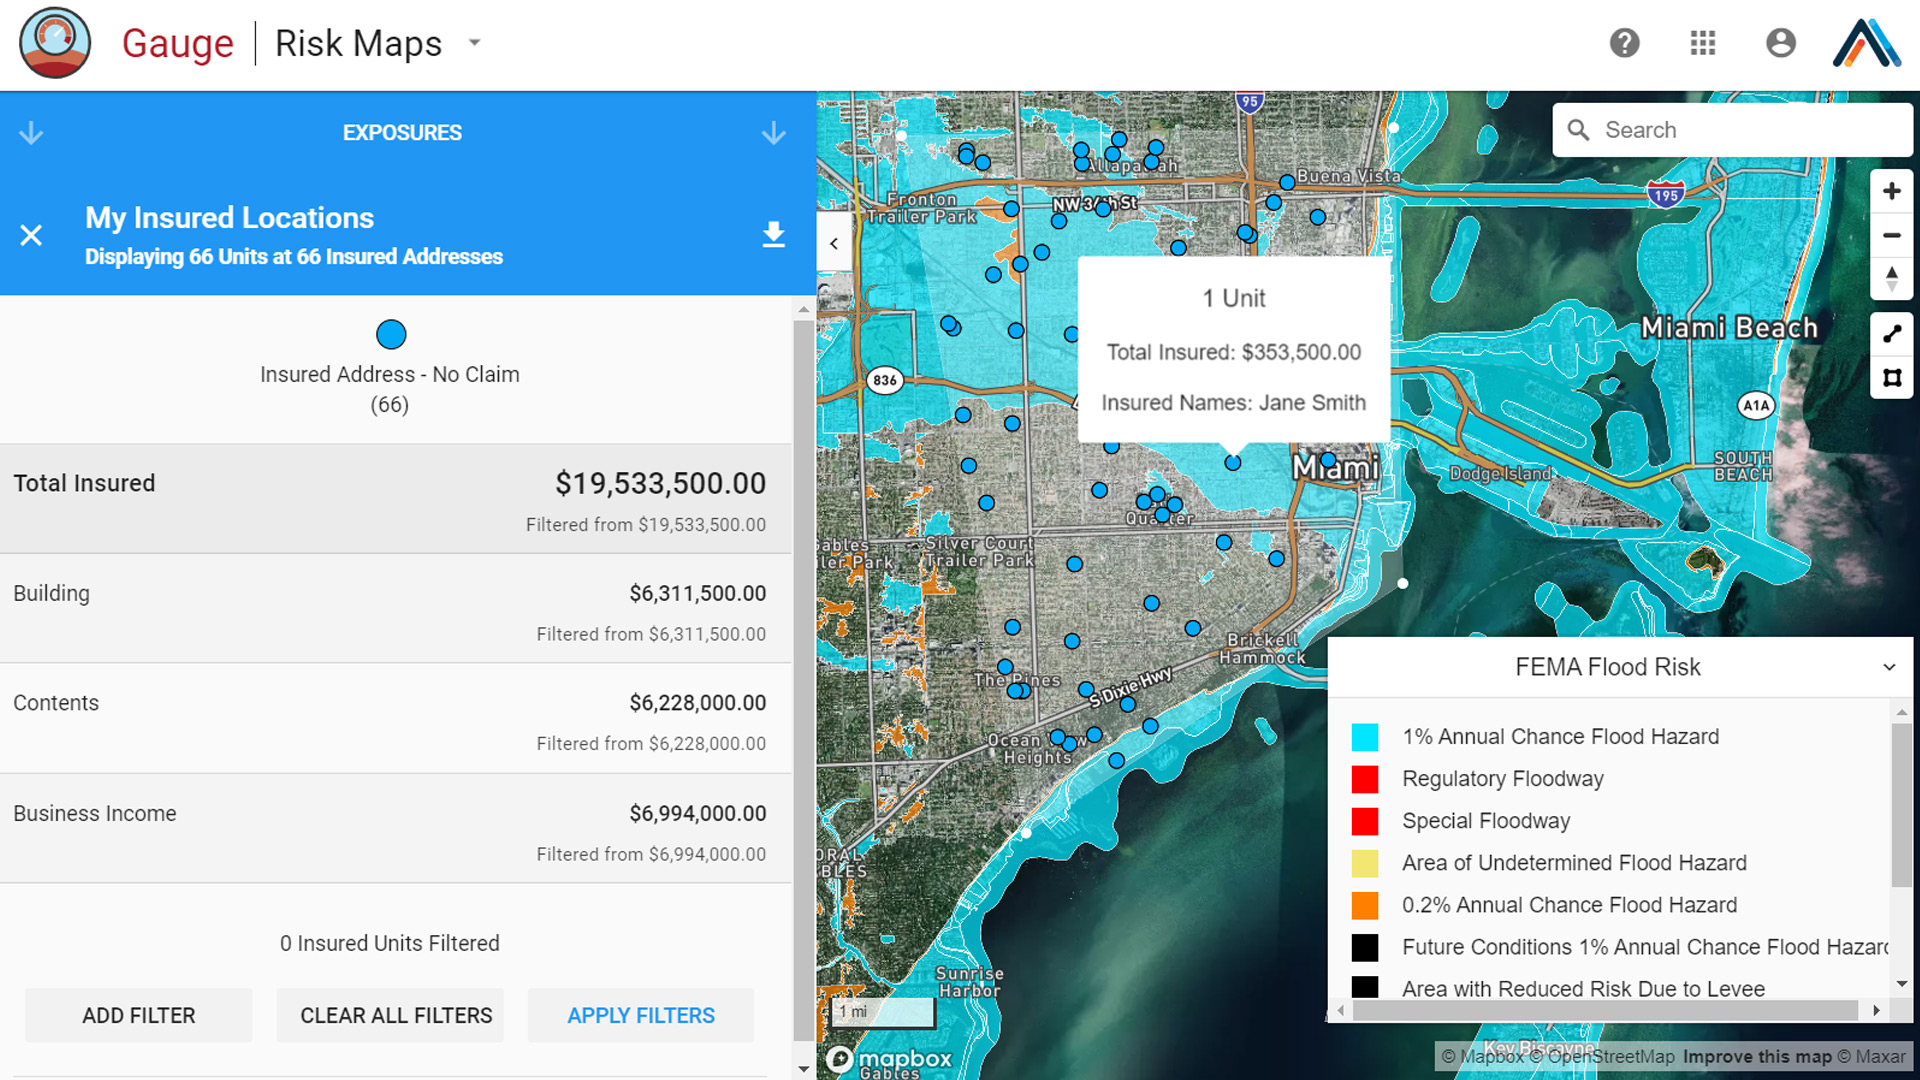
Combine all of your policies into a single dashboard.
Flood zones can vary widely based on geospatial attributes. One of your policyholders may be risk-free while their neighbor has a severe risk of river flooding from the next 100-year event.
GaugeFlood allows you to upload your policies into the dashboard and overlay them on risk maps to quickly identify high-risk policies or neighborhoods, search by address and draw a custom polygon to overlay all the policy exposures in a given area. You can even include custom data, such as policy numbers, property values and business income.


Product support
Call (888) 320-7693 or email us at support@athenium.com
Let’s get started
Schedule a demo, request pricing or speak with a member of the team.