

Jonathan Fairman PhD – Senior Scientist, Meteorology
Understanding the National Hurricane Center’s cone of uncertainty

Fig. 1: NHC public advisory for Tropical Depression Three (later Tropical Storm Cristobal), issued on June 2 at 10 AM CDT (15 UTC).
As of June 15, the 2020 hurricane season has already been an eventful one with three named storms, all of which impacted the United States. Arthur’s tropical storm-force wind fields impacted the Outer Banks of North Carolina on May 18, Bertha spun up and organized within hours to become a tropical storm and made landfall in South Carolina on May 27 and Cristobal began its life as Tropical Storm Amanda in the eastern Pacific before moving into the Gulf of Mexico and making landfall in Louisiana on June 8. One of the most commonly used evaluations of a storm and its track is the “cone of uncertainty” that is issued by NOAA’s National Hurricane Center. However, this cone does not tell the entire story of a storm.
One of the first messages told from the NHC in their graphic is: “The cone contains the probable path of the storm center but does not show the size of the storm. Hazardous conditions may occur outside of the cone”. However, it can be difficult to know exactly where these hazardous conditions can occur. It depends on not only the strength of the central circulation of the storm, but also other environmental factors. For Cristobal, this was even more apparent, as the NHC noted several times in their forecast advisories that the tropical storm-force wind field would impact the U.S. coast prior to landfall and extend well east of the center.
Forecasting Tropical Storm Cristobal
On June 2, 2020, Athenium Analytics released an upgrade to our BeaconHurricane product that provides improvements to our best track forecast. These upgrades include new best track precipitation swaths and enhancements to our wind swath forecasts. In the past, we made predictions of the wind footprint based on the strength of the storm and some information on its minimum pressure, which worked fairly well for the vast majority of storms. However, this was generally symmetric around the storm center, which for a storm like Cristobal, could have missed much of the area impacted by tropical storm-force winds. Our new swaths take advantage of our expertise in forecast blending, utilizing data from the American GFS and European ECMWF forecast models to create new footprints of a storm that reflect its true impact and any asymmetries that may be present.
These new swaths performed very well for Cristobal, with our first full forecast after the deployment (Fig. 2) at 10 AM CDT on June 2 producing a wind field that encompassed nearly all of the area impacted by tropical storm-force winds. As our wind swath forecasts extend to 10 days out from the initial time (compared to the NHC five-day cone), we were able to highlight storm impacts on the US Gulf Coast well before the NHC cone did.
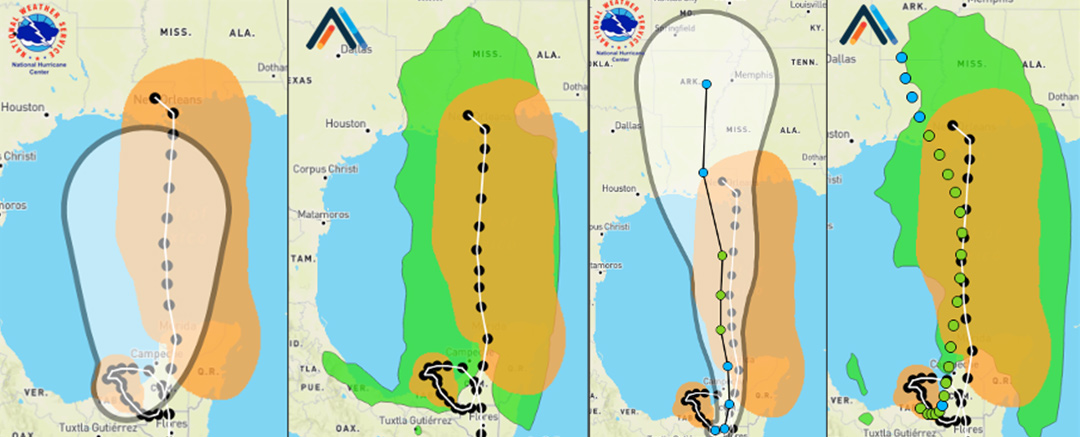
As Cristobal became better resolved by the NHC, the size of the cone shrank (Fig 3). This was because of greater certainty in the location of the storm center. However, as the left side of Fig. 3 shows, this means that much of the tropical storm-force wind field of Cristobal fell outside the cone. The Athenium Analytics best track swath (Fig. 3, right) encompassed virtually all of the tropical storm-force winds recorded, including impacts on the east coast of Mexico and in Florida and Alabama that fell outside the NHC forecast cone.

Fig. 2: Left – NHC “cone of uncertainty” for Cristobal on June 2, 2020 issued at 10 AM CDT (15 UTC) with tropical storm-force wind field from NHC best-track analysis (black dots indicating center and orange indicating swath). Right – Our tropical storm-force wind swath (green) with NHC best-track analysis and wind swath (orange) for the BeaconHurricane forecast issued on June 2, 2020 at 10 AM CDT (15 UTC).

Fig. 3: Left – NHC cone and track forecast (left) overlaid on NHC best-track analysis (black dots) and tropical storm-force wind swath (orange) issued on June 4, 2020 at 10 AM CDT (15 UTC). Right – NHC best track analysis (black dots) and tropical storm-force wind swath (orange) overlaid with our best track (colored dots) and tropical storm-force wind swath (green).
A better hurricane forecast tool for insurers
The NHC cone is one of the most commonly used representations of tropical cyclones in the U.S., and it does exceptionally well at what it is designed to do – track the center of a storm’s circulation and give an envelope of potential central storm tracks. However, it is not designed to show storm footprints and onshore impacts. With these new enhancements to the Athenium Analytics wind swaths, we have designed a product that extends further in time than the cone and much more accurately identifies areas that are at risk of tropical cyclone activity. Our hurricane forecasts were built using state-of-the-science methodology and leverage our expertise in analysis of atmospheric numerical modeling data. When you need more information than the cone provides, or want to get a better impact on how tropical storm-force or hurricane-force winds may impact your book of business, you can turn to our BeaconHurricane software.
To learn more about our full suite of hurricane analytics tools for insurance carriers, visit our hurricane response page now.
About the author
 Dr. Jonathan Fairman is the senior scientist of meteorology at Athenium Analytics. He’s an expert in atmospheric phenomena across all scales, from severe convective storms to global climate change. He leads development across all of the Athenium Analytics atmospheric products, with recent work on Atlas and Dexter. Jonathan was born in Cleveland and holds BS and MS degrees in atmospheric science from The Ohio State University and a PhD from The University of Alabama in Huntsville. He’s also a classically trained trumpet player and performs with ensembles throughout New England when he’s not sitting at a computer thinking about the weather.