California is currently experiencing the most destructive wildfire event in state history. Between the Camp Fire near Chico, the Woolsey Fire in Los Angeles, and the Hill Fire in Ventura County, more than 243,000 acres have already burned across the state this month. The losses sustained are unprecedented, including 58 deaths, dozens of injuries and more than 9,000 structures destroyed in just a week’s time.
All three of these fires began on Thursday, November 8, and thousands of fire personnel continue to work around the clock to contain the blazes. However, it may be several more weeks before the fires—particularly the Camp Fire—are 100% contained. And while there has been ample coverage on the sheer destruction of these fires, there is not as much information about the factors that contributed to their size.
A closer look at the wildfire risk data in Southern California
At Athenium Analytics, a key part of our value proposition is helping customers understand the weather-related risks associated with their properties, businesses, and portfolios. Our scientists analyze years of historical weather data along with numerous other environmental risk factors to understand the true risks of perils like tornados, hurricanes, severe winds and of course, wildfires.
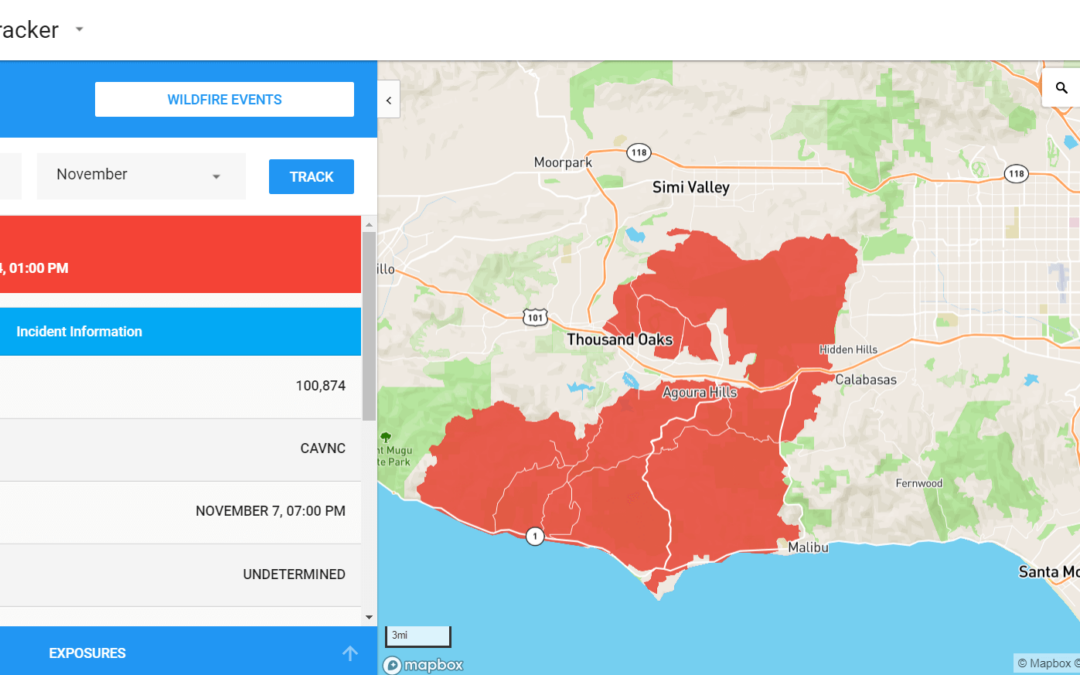
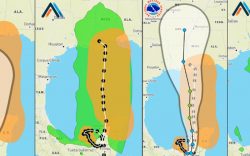
When analyzing wildfire risk, our models consider factors like topography, fuel sources, fire defensibility, and weather patterns. Below is a wildfire risk map pulled from our Gauge Underwriting software. It shows the relative wildfire risk in the area of Agoura Hills, the geographical center of the current Woolsey fire in southern California. The chaparral vegetation ecosystem, frequent fire weather conditions and rugged terrain in the wildlands north of Malibu make this area particularly susceptible to severe wildfires. The 8.6 score is significant. Only about 7% of land in the United States has a wildfire score of 8.1 or above in our models.

The data tells us that the environmental risk factors are there. But what about the wind patterns—did they cause almost 100,000 acres in Southern California to go up in flames?
How wind patterns contributed to the California wildfires
Our meteorology data suggests extreme wind gusts have been the biggest catalyst behind the speed of spread and intensity of the Camp and Woolsey fires. More specifically, the offshore flow from a strong seasonal jet stream has raised temperatures, dried out vegetation and caused powerful wind gusts that spread the flames quickly across the vulnerable landscape. On top of that, gusts of 60+ mph also make it more difficult for fire personnel to contain the blazes by reducing aerial visibility and temporarily grounding planes. The meteorology team at Athenium Analytics took a closer look at the wind data surrounding the fires to see what they could learn.
A closer look at the Woolsey wildfire wind data
The Dexter tool from Athenium Analytics provides a different look at the weather hazards around the Woolsey fire currently raging north of Malibu. Dexter is a post-event forensics and verification tool that provides accurate, hyper-local weather data after a major hazard has occurred. Dexter is popular among insurance claims departments because it allows employees to assess and verify local weather events in areas across the United States. But in this case, we can use Dexter to view straight-line wind data in the area of the Woolsey fire. How fast were the sustained winds (and gusts) during the first few days after the blaze began? Our meteorology team took a closer look.
Just eight hours after the Camp Fire began in northern California, the Woolsey fire ignited in southern California. Simultaneously, the area around Thousand Oaks experienced uncharacteristically high winds that fanned the flames and pushed embers across already dry vegetation.
Leigh Munchak, Vice President of Meteorology at Athenium Analytics, provided some additional insight on these severe wind patterns:
“These strong winds, known locally as Santa Ana winds, are not uncommon in California during the cool season. The Santa Ana winds are a type of strong winds known as katabatic winds, which occur when high-density air at a high elevation flows down a mountain slope. The air accelerates due to gravity, producing strong winds. In Southern California, the winds can be even more intensified as they are funneled through narrow mountain gaps. These Santa Ana winds were widespread throughout California on November 8, which caused fires to spread rapidly.”
The graph below shows the timing of the Santa Ana winds along the Malibu coast. At around 6 am on Thursday, November 8, sustained winds jumped suddenly from around 10 mph up to 30 mph—and gusts reached 60 mph. These powerful winds continued for nearly 48 hours, transforming ordinary fires into catastrophic blazes that quickly threatened lives, homes and infrastructure.

In fact, much of the region surrounding the Woolsey fire was hit by these same wind patterns. On November 9, the day after the Woolsey fire began, much of the region experienced wind gusts between 50 and 69 mph, including a few pockets northeast of Thousand Oaks that saw wind gusts of 70+ mph throughout the day. There’s no doubt that strong winds not only helped spread the Woolsey fire, but also disrupted efforts by the thousands of fire personnel tasked with containing it.
The map overlay below shows just how widespread the Santa Ana winds were across the region on November 9, 2018.

While the cause of the Woolsey fire is not yet known, our data clearly shows the strength of the wind patterns have been a key factor in the fire’s movement and intensity. As the data continues to roll in, our meteorology team will be looking for new details to help us understand the impact of weather and climate on this major event. Stay tuned for additional updates and visit our products section to learn more about the Gauge and Dexter solutions shown above.
For more reading about the science behind the fires, we suggest this interesting article from Wired.com that discusses the wind patterns in California. At the time of publishing, the latest statistics for the fires are listed below:
Camp Fire
– Northern California (outside of Chico)
– 63 fatalities
– 12,000+ structures destroyed
– 142,000 acres burned
– 45% contained
Woolsey Fire
– Southern California (near Malibu)
– 3 fatalities
– 616 structures destroyed (57,000 more in danger)
– 98,000+ acres burned
– 69% contained
Hill Fire
– Southern California (Ventura County)
– 4 structures destroyed
– 4500+ acres burned
– 100% contained
The data above is available thanks to CalFire and we recommend you visit their website for the latest updates.
Related posts
 What the 2019 CSU hurricane forecast means for insurance carriers & reinsurers – plus a hurricane stats infographic
 Why don’t hurricanes hit California?
 Understanding wildfire risk to write, renew and optimize insurance policies
 Asymmetry in hurricane forecasts: Why you need more than the cone of uncertainty