
As Hurricane Juliette swirls harmlessly in the Pacific Ocean off the West Coast and Dorian continues to batter the East Coast, you may wonder why one side of the U.S. is more hurricane-prone than the other. The answer points to the connectivity of weather systems that meteorologists must understand and consider when forecasting these convective weather events.
History of west coast weather threats
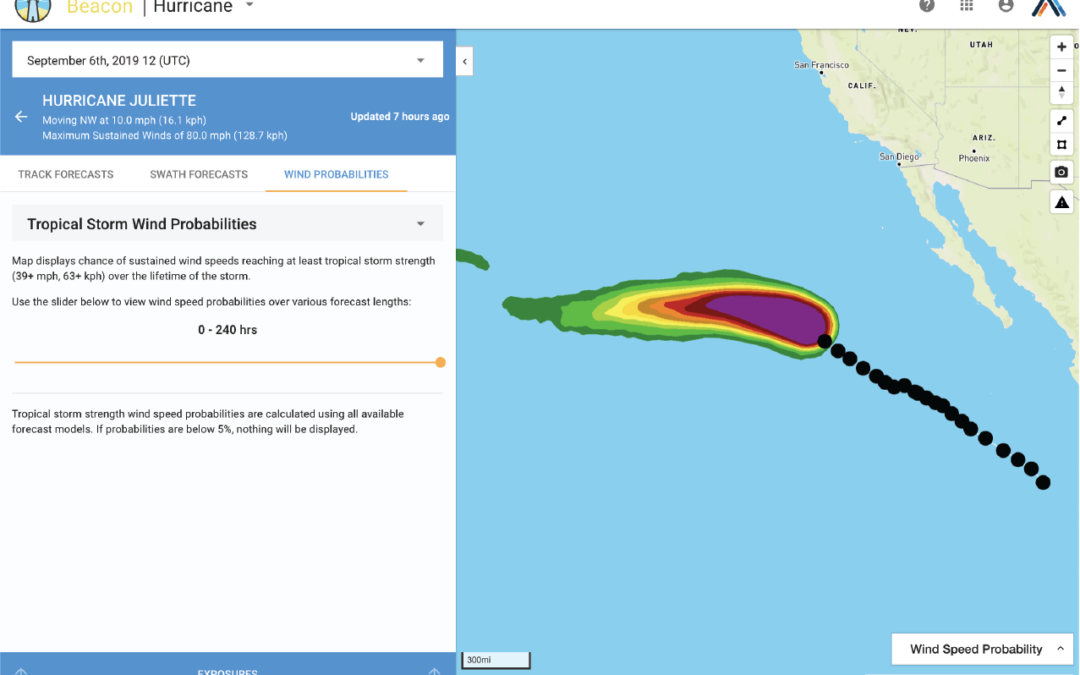
Hurricane Juliette formed as a tropical storm on Sept. 1, 2019, in the eastern North Pacific Ocean, approximately 685 miles south-southeast of the southern tip of Baja California. It quickly strengthened into a powerful Category 3 hurricane, and BeaconHurricane forecasts it to weaken as it tracks westward. It will break up well before it hits land and will end up being nothing more than a statistic in what is forecast to be a busier-than-normal hurricane season.
Juliette’s significance, though, is in its relatively mundane lifecycle: Even though it formed near Mexico, it was never really a threat to land. Although tropical storms and hurricanes frequently form in the eastern Pacific, they are unlikely to ever make North American landfall — and if they do, they typically only affect western Mexico.
In fact, as history shows, very few recorded tropical storms have ever made landfall in western Mexico, and we have to look back to 1939 to find a tropical storm that made direct landfall on the California coast.
In 1858, well before we began to name storms, an extremely rare hurricane hit San Diego and damaged homes, construction projects and corn crops as north as Visalia and Los Angeles with excessive rainfall but low winds. In terms of today’s damage estimates, the storm caused around $500 million in damage.
Understanding the climatic conditions
So far, the 2019 eastern North Pacific hurricane season has seen 12 tropical systems, including Hurricane Juliette. While these storms can form and even thrive, there are environmental conditions that prevent them from making landfall.
First and foremost, hurricanes need warm sea surface temperatures to gain power — typically temperatures greater than 80˚F (26.6˚C). However, relatively cool waters bound the eastern North Pacific (30N to 50N) at much higher latitudes than the Atlantic, resulting in sea surface temperatures below 75˚F (23.9˚C) off coastal California. This does not supply the hurricane with enough thermal energy to support its development — in fact it does just the opposite and works to slow down and break up storms.
The second factor is the fact that prevailing trade winds steer hurricanes and tropical storms; in the Northern Hemisphere, this fuels the track from east toward the west-northwest. The forces that push Atlantic hurricanes (like Dorian) toward the east coast of the U.S. with such intensity are the same that push the Pacific storms away from the West Coast.
California’s real perils: it’s all related
This does not, however, mean that California (and, more broadly, the West Coast) is immune to natural disasters. In fact, the summer rainfall that tropical storms provide cannot often reach that far north without completely dissipating. This lack of relief is related to California’s main peril: wildfires. Catastrophic wildfire risk will increase as we move into fall, the driest part of the year for this region.
At Athenium Analytics, we offer two solutions to help insurance carriers predict, track and verify damage from wildfires:
GaugeWildfire is the insurance industry’s premier wildfire risk analysis and portfolio management tool. It combines historical weather and wildfire data with risk scoring and map visualizations to help insurers make smarter underwriting decisions by understanding the true risk of catastrophic fires. Comprehensive modeling includes a property’s proximity to high-risk variables and up to 50,000 years of simulated data.
DexterWildfire is a cloud-based solution that enables you to verify P&C insurance claims by providing the most current hazard and location data for wildfire events. In combination with Dexter’s unprecedented 0.36 square-mile resolution historical weather data, you can better understand wildfire ground conditions at exposure locations (updated four times per day) or past years for over 16 million land segments.
Discover how our wildfire risk scoring and post-event verification tools can change the way your business operates. Sign up for a free demo today!