
From hurricane landfalls to tornado chasing, our meteorologists have experienced weather phenomena that truly show the danger, beauty and force of the natural world. In this recurring blog series, we tell real weather stories from their unique perspectives.
In this edition, Justin Jones, manager on the earth and atmospheric sciences team, shares his experience and memories of a historic flood that occurred in the Red River Valley in North Dakota because of extreme seasonal snowfall.
The Red River Flood of April 1997 was exceptionally rare in that it exceeded the 500-year statistical recurrence interval at East Grand Forks, N.D., but also because it was such an incredible forecast failure.
Typically, spring flooding occurs throughout the Red River Valley bordering Minnesota and North Dakota as the snow melts; most years there’s a period when the river is near or above flood stage. In 1997, the effect was heavily magnified by excess snowfall (117 inches versus an average of 42 inches) from eight blizzards.
The last blizzard of the season developed on April 3 and was the most severe, producing heavy amounts of freezing rain and snow and resulting in long-lasting power outages across the region. These outages were particularly dangerous given the extremely low temperatures and high winds. Our family was fortunate to stay relatively warm in the basement, but others were not as lucky.
While the direct effects of the blizzard quickly improved, it created a critical situation for forecasters who were trying to predict the upcoming period of flooding. I remember it being a time of great anxiety, as higher and higher flood stage predictions rolled in; there was really no historical precedent for an event of this nature. The peak crest height was projected to be near 49 feet. But in the days leading up, it became clear that the flooding would far exceed that level.
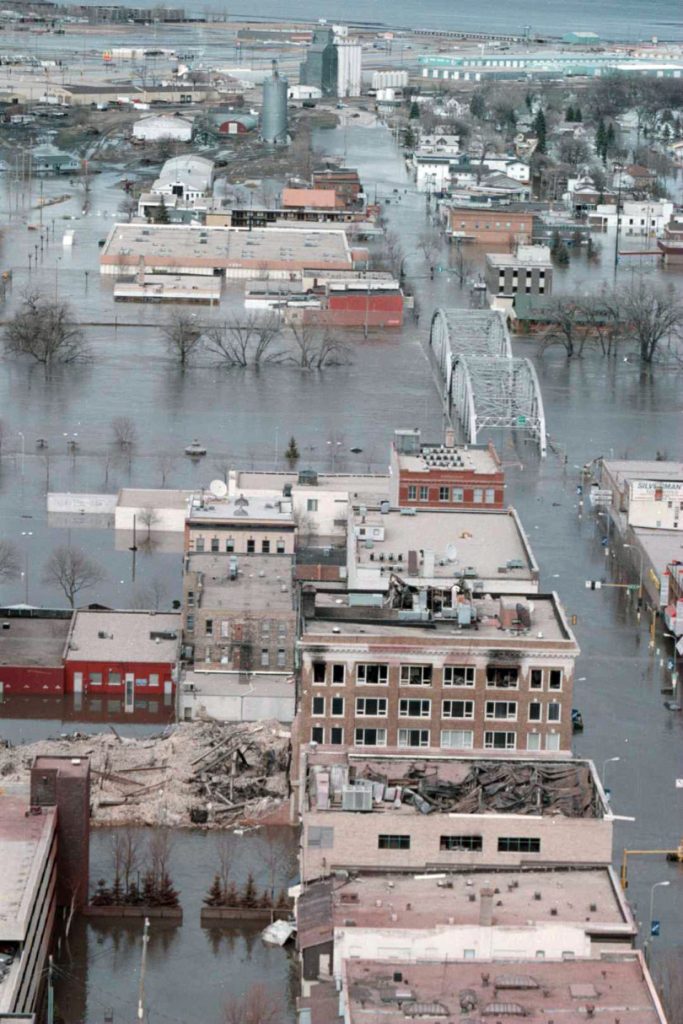
The entire community gathered to fill sandbags to protect individual neighborhoods. Since an existing levee along the banks of the Red River was only intended to protect against a crest of 52 feet or lower, a temporary dike was constructed through the center of the city of Grand Forks to ensure homes and businesses west of it would be spared. In all likelihood, everything to the east would be a total loss, including the entire downtown business district and many residential homes. It was surreal seeing this dike constructed along the middle of a road we had traveled on so frequently.
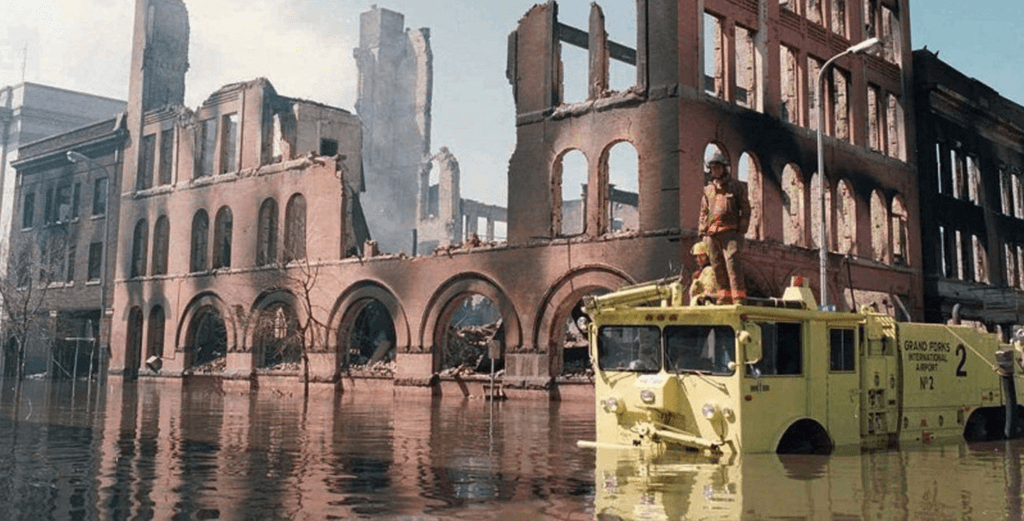
 The river eventually crested at 54.35 feet at East Grand Forks on April 21, about five feet higher than the original National Weather Service estimates. 90% of Grand Forks residents had been evacuated, many to Grand Forks Air Force Base 15 miles west of the city, where our family was located. The aircraft hangars and schools on the base were used as temporary shelters; we did not have school for the remainder of the year. At the height of the event, we could see massive plumes of smoke rising from Grand Forks as many buildings downtown burned.
In response to the event, floodplains were identified and cleared of future development, and a new system of levees were developed to better deal with the certainty of future floods.
Writer Bio
 Justin Jones is a manager on the earth and atmospheric sciences team at Athenium Analytics, where he plays a critical role maintaining production systems that feed data into our solutions. He received a B.S. and M.S. in atmospheric science from the University at Albany, with a focus on intraseasonal climate variability and research describing how and why the stratospheric polar vortex perturbs in winter. He spends his free time playing ultimate frisbee and listening to podcasts.
Photo credit: Twin Cities Pioneer Press website (https://www.twincities.com/)
___________
With GaugeFlood from Athenium Analytics, insurers can score and visualize flood risk at any address based on a number of factors including elevation, distance to water and nearby FEMA flood zones.
- Flash Flood— Our risk map scores locations based on soil hydrologic attributes, land use and land cover types, rainfall intensity and topography to help you determine which areas are prone to flash floods.
- River Flood— Studies show inland flood plains could expand by 45% by 2100. We score the risk factors including elevation and distance to water to model runoff depth for 50-yr, 100-yr, 500-yr and 1000-yr storm events.
- Storm Surge— Our storm surge module offers risk scores and proprietary modeled inundation levels for tropical storm and hurricane storm surge heights and levels. Factors include distance to coastline, elevation and hurricane frequency scores.