Introduction
The July 2021 GaugeWildfire product update provides comprehensive enhancements to U.S. wildfire risk scores, delivering better insights and more data to help understand wildfire risk across your book of business. The key driver of this update is to incorporate:
- More recent wildfire history data
- New perils that are known to have an impact on wildfire risk
- Scientific advancements in the study of wildfire and modeling methodologies
Collectively, this update provides an improved assessment of address-level wildfire risk across the contiguous U.S.
The science behind the scores
GaugeWildfire risk scores are calculated through a combination of deterministic and probabilistic modeling. The foundational dataset of the probabilistic modeling is a 10,000 to 50,000-year stochastic event set of simulated wildfires, created by feeding state-of-the-art model inputs to a fire behavior model, which provides accurate predictions of potential fire behavior and frequency. The event set of simulated wildfires is the main driver of the frequency and severity components for the risk scores.
The inclusion of new attributes that impact wildfire risk will significantly enhance GaugeWildfire risk scores across the contiguous U.S. The frequency component now considers attributes such as the distance to the nearest electrical transmission line and the probability for ember-driven ignition and the severity component now includes new attributes related to crown fire potential, ember cast area and high-speed wind scenarios.
Lastly, the new wildfire risk scores take into account wildfires that have occurred since the last update. Historic fires through the year 2020 are now factored into the GaugeWildfire risk scores.
Changes to GaugeWildfire
GaugeWildfire risk scores range between 1.0 and 10.0, where 1.0 is nominal risk and 10.0 is extremely high risk. These scores are available for all 48 states within the contiguous U.S.
Additionally, each location now has an overall risk score, as well as supplemental scores for frequency, severity, community, mitigation and damage. Each supplemental risk score incorporates various attributes that are displayed within GaugeWildfire, along with a corresponding low / medium / high indicator.
GaugeWildfire continues to segment the land surface of the U.S. into unique land segments, differentiated by local topography and vegetation. The land segments fall into four different categories: wildland, light development, urban fringe and minimal exposure likely. Each category has a subset of unique attributes, which are factored into the overall risk score.
Trends in the new scores
The predominate trend observed within the wildfire update is an overall shift to higher risk scores. With this updated scoring model, clients will see fewer land segments with a GaugeWildfire risk score of 1.0. Our experts say this is representative of the “new normal”, with generally higher wildfire risk across the United States.
In GaugeWildfire, the risk scores translate as:
- 1.0 to 2.7: Low risk of wildfire
- 2.8 to 5.5: Medium risk of wildfire
- 5.6 to 7.9: High risk of wildfire
- 8.0 to 10.0: Very high risk of wildfire
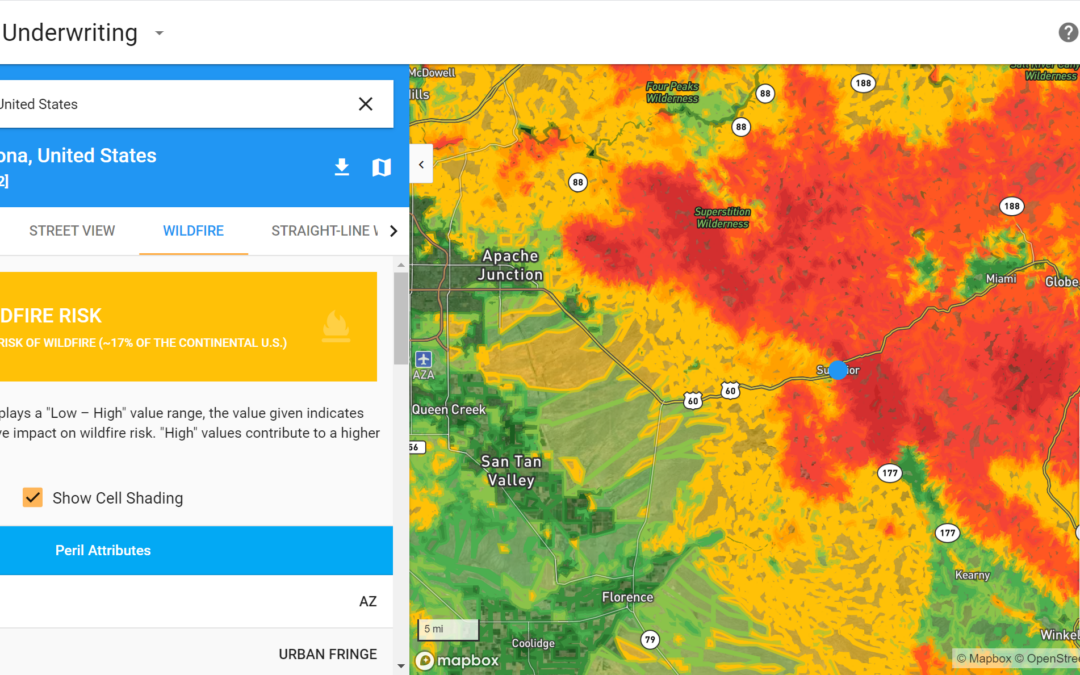
The trend toward overall higher wildfire risk across the U.S. is evident in Figures 1a and 1b below, which visualize the new GaugeWildfire risk scores alongside those from the previous model. Approximately 60% of the Gauge cells have a higher wildfire risk after the update. Alternatively, approximately 35% of the Gauge cells experienced a decrease in wildfire risk after the update.

Figure 1a: Previous version of GaugeWildfire

Figure 1b: Updated version of GaugeWildfire
The updated Gauge risk scores can also be validated against real-time data. For purposes of illustration, the Telegraph Fire, which ignited near Superior, AZ in early June 2021, encompassed much of an area with risk scores of 7 or greater, but did not encroach on areas with risk scores lower than 5. Figure 2 below shows the western part of the fire, with the footprint in grey overlaid on the GaugeWildfire software.
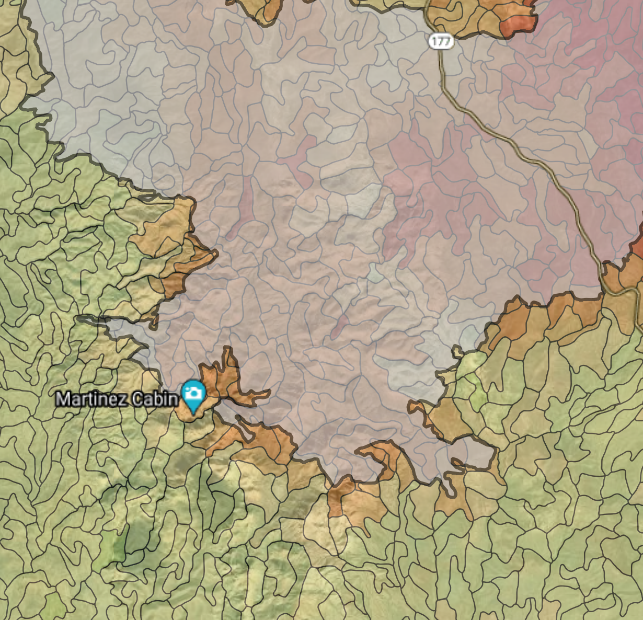
Figure 2: Comparison of GaugeWildfire risk scores with Telegraph fire perimeter in Superior, Arizona (fire perimeter shown in grey with black outline).
To schedule a demo or speak with a representative from our team, please submit a contact request form or reach out to your Athenium Analytics account manager today.
Related posts
 How IRIS aerial imagery analysis brings AI machine learning to insurance
 Hail damage, wind gusts, and tornado alerts highlight August new releases
 Global data, local impact: using granular weather data to manage business risk
 Announcing significant updates to our hurricane forecast & analytics suite