From hurricane landfalls to tornado chasing, our meteorologists have experienced weather phenomena that truly show the danger, beauty and force of the natural world. In this recurring blog series, we tell real weather stories from their unique perspectives.
In this edition, our senior scientist of meteorology, Dr. Jonathan Fairman, shares his thrilling experience of being a part of a record-breaking tornado outbreak in Huntsville, Ala., in a tale worthy of a Hollywood script deal.
On April 27, 2011, I was a PhD student at the University of Alabama in Huntsville (UAH). It was nearing the end of my fifth year, and I was getting devilishly close to that point that every PhD student dreads: being in the weeds of your dissertation, where it’s literally the only thing that stands between you and being called “doctor.” The goal of that day was to finish the first draft of the first part of my dissertation. It didn’t happen.

Significant tornado parameter forecast for the afternoon (3 p.m. CDT, local time) of April 27, 2011.
I woke up to tornado sirens. A mesoscale convective system had transitioned into a quasilinear convective system, causing numerous tornadoes and forming a mesoscale vortex. Basically, everything in the atmosphere was spinning with every ingredient characteristic of tornadic formation. Atmospheric elements and readings combine into the Significant Tornado Parameter; values of greater than 5 indicate environments that can have major damaging tornadoes. That day, the value exceeded 12.
After checking the weather conditions, I drove into my office to start data analysis and check the code that had been running overnight. Several professors and graduate students were prepping the mobile radar and other instruments to sample the storm. I was invited to deploy with them but declined multiple times; I was determined to meet my self-imposed dissertation deadline. I put in headphones and attempted to keep as on-task as possible, distracted occasionally by someone’s enthusiasm at the atmospheric setup.
Just before lunch, the sirens sounded again. My department was housed in the same building as the Huntsville National Weather Service (NWS) office, and in this case, the NWS used the internal speakers to advise all of us to take cover. Usually, when this happens in a meteorological department, half the scientists take cover, and the other half go to the roof to see what’s going on.
I was one of the latter. We spotted a wall cloud approaching. Several tornadoes tracked towards us and more occurred just to the north of UAH. As the line passed over, my officemate Ryan monitored the vertically pointing radar from the parking lot. Taking observations six times per second, it recorded updraft speeds of 51 mph — about double typical thunderstorm updraft speeds.
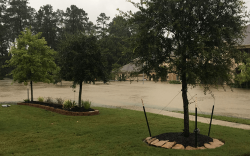
With half the day gone and progress on my dissertation flagging, schools throughout northern Alabama, including UAH, officially closed – and conditions were actually getting worse. The line of thunderstorms that had moved through Huntsville that morning combined with the high winds from the midday thunderstorms to weaken the power grid, causing power blips. At 2:30 p.m., one of these blips erased nearly 24 hours of my dissertation work. I took the hint and joined Ryan and his adviser, Prof. Kevin Knupp, in the parking lot to assist in a weather balloon launch to examine how the atmosphere was setting up for the final set of storms predicted to come through in the next few hours.
What followed was something I’m not sure if I’ll ever experience again.
Map of tornado paths on 27 April 2011. Tornado path color corresponds to the EF scale.
Around 3 p.m., the storms started becoming supercells across most of western Mississippi and Alabama. Normally, supercells only form tornadoes ~20% of the time. In Alabama this afternoon, the supercells formed tornadoes 90% of the time. And those tornadoes were some of the strongest that had ever been recorded.
The Fujita and Enhanced Fujita (F/EF) scales measure tornado strength based on the damage left behind. For a tornado to be classified as an EF4, it has winds exceeding 165 mph and will destroy well-constructed buildings. For tornadoes classified as EF5, those wind speeds are above 200 mph and will strip a well-constructed house to its foundation. On the afternoon of April 27, 2011, there were two EF5 tornadoes in Alabama and seven EF4 tornadoes. Some of these tornadoes were on the ground for over two hours. And they were heading towards Huntsville.
The only people working in my building were the meteorologists at the NWS office. Everyone else was glued to the computer, watching live radar updates, local TV stations and TV coverage in Birmingham. We watched a giant, wedge-shaped tornado move through the center of Tuscaloosa. At about 4:15 p.m., the NWS again came over the speakers and said to take cover. Knowing how the day was proceeding and that the supercell heading towards the building had been confirmed as a large tornado (later noted as an EF5), everyone actually listened.
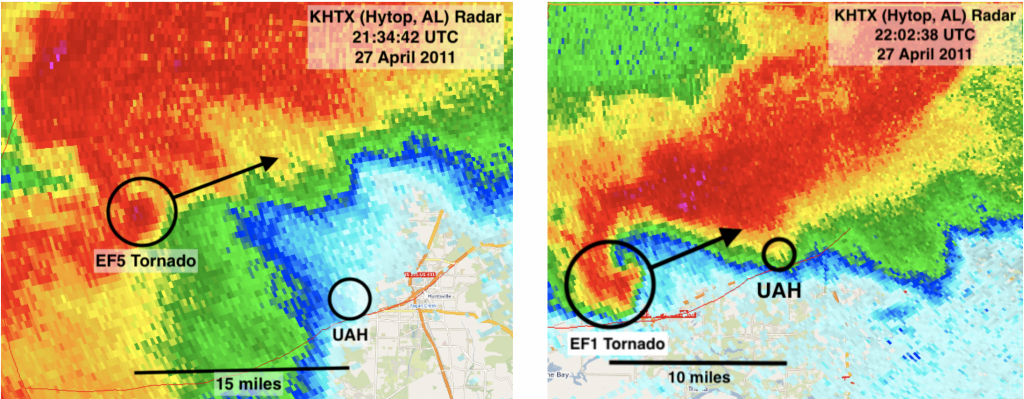
Radar images at 4:34 p.m. and 5:02 p.m. showing the location of the Hackleburg/Phil Campbell EF5 tornado and the Madison EF1 tornadoes, as well as my location at UAH. Arrow indicates storm direction.
Those of us who had chosen to stay went down to an interior hallway on the lowest floor of the building. We sat with our laptops and iPhones, frantically updating the radar. The tornado associated with the EF5 in Hackleburg moved to our north, heading through the town of Harvest, where many of our colleagues lived. After this supercell passed, another formed and started tracking directly towards UAH. Luckily, it too moved north, eventually receiving an EF1 rating.
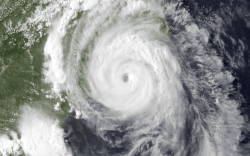
A little after 5 p.m., the local weather radar lost power, so we switched our radar feeds to those from Birmingham, Nashville and anywhere else that could see the storms moving over us. The building lost power not too long after, leaving us tethered to our phones and trying to follow the storms. The Birmingham radar lost power at 6 p.m. With no local radar coverage possible, we waited until the all clear could be seen from satellite images and the Nashville feed.
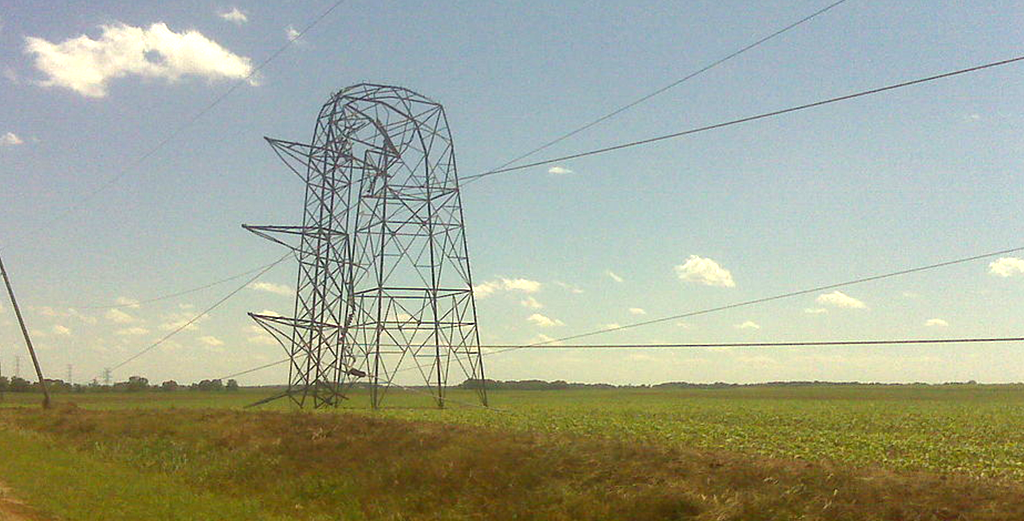
While most people within the city limits of Huntsville were not directly affected by the tornado outbreak, there was no power (and wouldn’t be for a week). UAH was shut down for 2 weeks during recovery efforts, and a dusk-to-dawn curfew was issued in Huntsville. Every single high-voltage power line into Huntsville had been hit by a tornado. Devastating damage was present in Madison County, some coming within less than a mile of my PhD adviser’s home, along with the homes of several other colleagues.
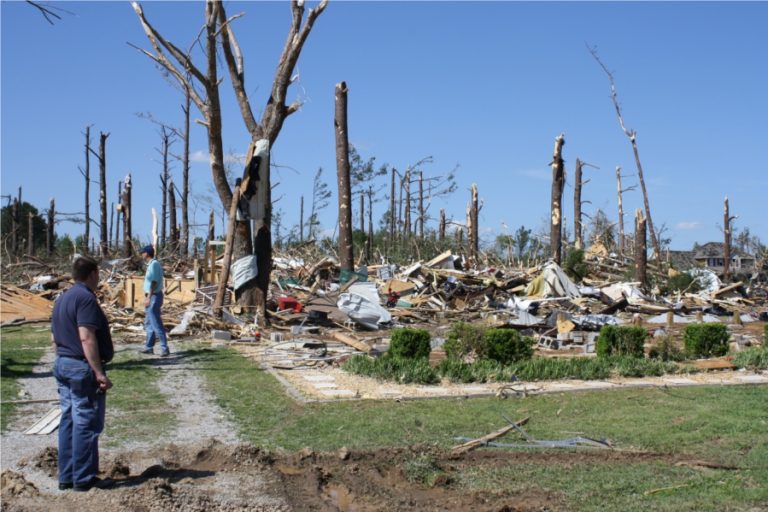
EF4 damage in the Anderson Hills development in Harvest, AL. Trees are debarked and stripped, and a house is completely destroyed down to the foundation. Photo credit: Huntsville NWS
Initial estimates were that 1% of the total area of Alabama was impacted by a tornado that day. Post-event classification indicated there had been 292 tornadoes over 16 states on April 27, causing more than $11 billion in damage and resulting in 316 people losing their lives; 238 of them were in Alabama. This made it the single deadliest tornado event since March 18, 1925, when there had been no warning, no infrastructure, no radar and no dissemination process. We had smartphones, live radar feeds over the internet, TV, radio, tornado sirens and dedicated weather forecasting staff at several NWS offices. Without the dedicated efforts of the people involved getting the forecast out that day, many more could have been affected.
My meteorological career (and personal life) was very much shaped by the events on April 27. I did not finish my dissertation by August, as I couldn’t access much of my data for weeks after the storm. Without that delay, I would not have received the opportunity to go to the University of Manchester in the U.K. for six years, leading me on the path to my job here at Athenium Analytics.
From all sides, this event shows why studying weather is important to people in today’s modern world and the need to have excellent sources of data and information present at all times. These personal experiences have led me to become a better scientist. When I was recently given the chance to revise the Tornadic Storm layer in the Athenium Analytics DexterTracker product, I thought back to what type of product I would have liked to have seen on April 27, 2011, namely updating in real time, and designed my upgrade to fulfill that purpose.
Writer Bio
 Dr. Jonathan Fairman is the senior scientist of meteorology at Athenium Analytics. He’s an expert in atmospheric phenomena across all scales, from severe convective storms to global climate change. He leads development across all of the Athenium Analytics atmospheric products, with recent work on AtlasForecast and DexterTornado. Jonathan was born in Cleveland and holds BS and MS degrees in atmospheric science from The Ohio State University and a PhD from The University of Alabama in Huntsville. He’s also a classically trained trumpet player and performs with ensembles throughout New England when he’s not sitting at a computer thinking about the weather.
References:
Knupp, K.R., T.A. Murphy, T.A. Coleman, R.A. Wade, S.A. Mullins, C.J. Schultz, E.V. Schultz, L. Carey, A. Sherrer, E.W. McCaul, B. Carcione, S. Latimer, A. Kula, K. Laws, P.T. Marsh, and K. Klockow, 2014: Meteorological Overview of the Devastating 27 April 2011 Tornado Outbreak. Bull. Amer. Meteor. Soc., 95, 1041–1062, https://doi.org/10.1175/BAMS-D-11-00229.1
___________
Thanks to this dedicated work and the combined experiences of our staff, we can proudly recommend Dexter, our web-based weather forensics dashboard, to help insurers verify and manage weather-related P&C and crop insurance claims.
With Dexter, you can:
- View Enhanced Fujita scale (EF-scale) intensity ratings for tornadoes along with tornado paths, damage swaths, and damage points. Explore the technical details of Dexter’s algorithm and how data is processed in our new blog and whitepaper.
- See accurate storm data and paths within hours after a severe weather event anywhere in the contiguous U.S.
- Visualize your portfolio to assist with exposure management, loss mitigation and historical loss analysis.
- Generate hour-by-hour weather reports for key variables like rainfall accumulation, hail size, temperatures, wind speeds and more.
To get your free demo of these solutions, contact our expert sales staff today.